Why increasing your high-value audience mix doesn't always boost revenue—and why that's actually a strategic win. A data-driven look at portfolio optimization.
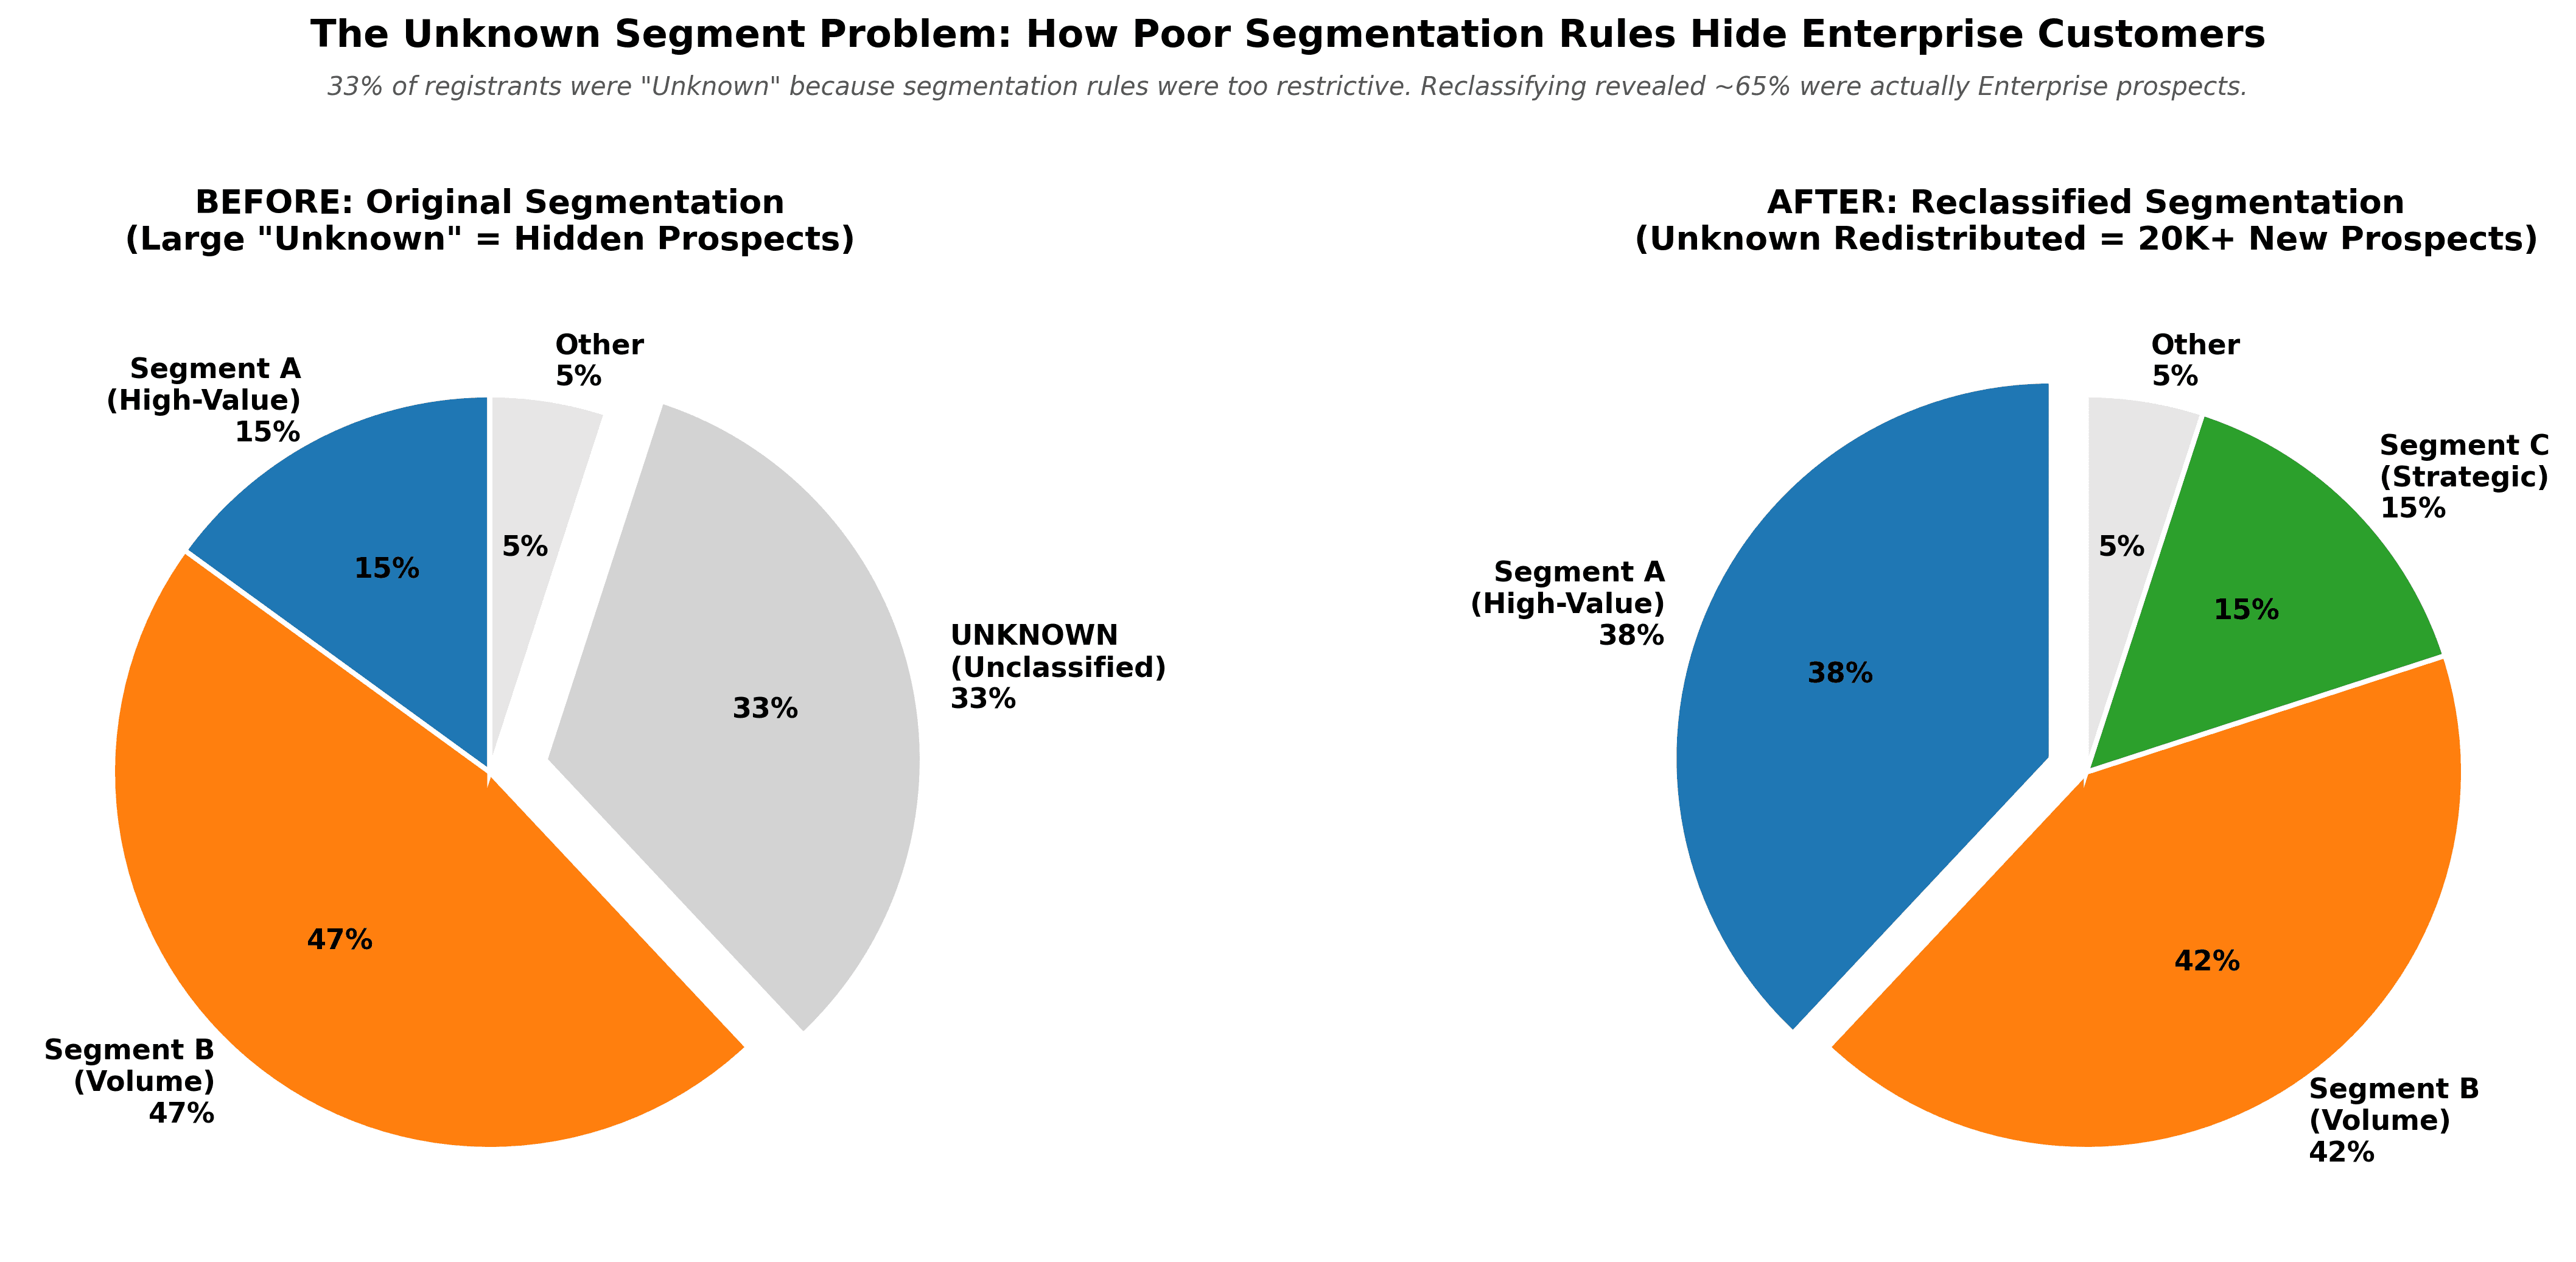
Most event planners obsess over one metric: total pipeline. More registrants = more pipeline. Better audience = more pipeline. But what if I told you that changing your audience mix might not move total revenue at all—yet it could be your most important strategic decision? This counterintuitive insight came from modeling five different audience scenarios for a 35,000-person event, and it fundamentally changed how I think about event planning.
The Flat Line Problem
When I built five progressive scenarios—each keeping registrants constant at 35,000 but shifting audience mix from 23% to 58% high-value segment—I expected a clear winner. Scenario 5 would dominate, right? Wrong. The total projected pipeline across all five scenarios ranged from $217K to $239K—a difference of less than 10%, well within statistical noise. This was baffling until I realized the math: if you keep total registrants constant and each segment has consistent pipeline-per-person rates, total revenue must stay roughly flat. Changing the mix isn't a revenue lever; it's a **portfolio composition lever.**
What Portfolio Composition Actually Controls
If total revenue doesn't change, what does matter? Everything else. Shifting from 23% to 58% high-value representation means:
- Segment contribution: High-value revenue grows from $48K to $146K (+204%), while volume segment shrinks from $99K to $58K (-41%)
- Sales process: More enterprise deals (longer cycles, larger sizes) vs. volume deals (faster closes, smaller sizes)
- Risk profile: Enterprise customers are fewer but higher-stakes; volume is more predictable
- Market positioning: You're signaling to your organization, "We're prioritizing high-value relationships" vs. "We're a high-volume platform"
None of these changes revenue, but all of them change strategy.
Why This Matters for Stakeholders
When I presented these findings, the executive reaction was telling. CFO asked: "Which scenario makes the most revenue?" Answer: They're all nearly identical. But then the VP of Sales asked: "Which scenario gives us more enterprise deals?" That's the right question. By reframing from "Which scenario maximizes revenue?" to "Which scenario optimizes our portfolio mix?", we shifted from a revenue problem to a strategic positioning problem. Scenario 3 (40.6% high-value) emerged as the recommendation—not because it generates $10K more revenue, but because it doubles our high-value presence while maintaining healthy volume.
The Database Feasibility Check
The clincher was validating that all scenarios were actually achievable. I calculated database coverage ratios for each scenario—essentially, what percentage of each audience segment would we need to invite? The results: even the most aggressive high-value scenario required only 0.54% of the available high-value database. This meant we could pursue any scenario without risk of audience depletion. Feasibility wasn't a constraint; it was a confirmation that portfolio optimization was the right lever to pull.
Event planning typically focuses on revenue maximization: "How do we drive more pipeline?" But sometimes the smarter question is: "How do we optimize the portfolio we're already generating?" Scenario modeling with constant registrants revealed that revenue is a function of registrant count × segment mix + historical rates. Once you reach your registrant target, portfolio composition becomes your strategic variable. This reframes event planning from a volume problem to a positioning problem—which might be more important to your business anyway.
What's your biggest challenge with event audience planning—total revenue, or portfolio composition? Drop a comment below.
